Due to its remarkable success record in traditional markets, a golden cross pattern on the charts excite cryptocurrency traders because it offers opportunities for profit in the future.
In contrast to the bearish death cross pattern, the golden cross tends to come before long-lasting uptrends. For instance, since 1970, the S&P 500 has typically returned gains of roughly 15% in less than a year following the occurrence of a golden cross.
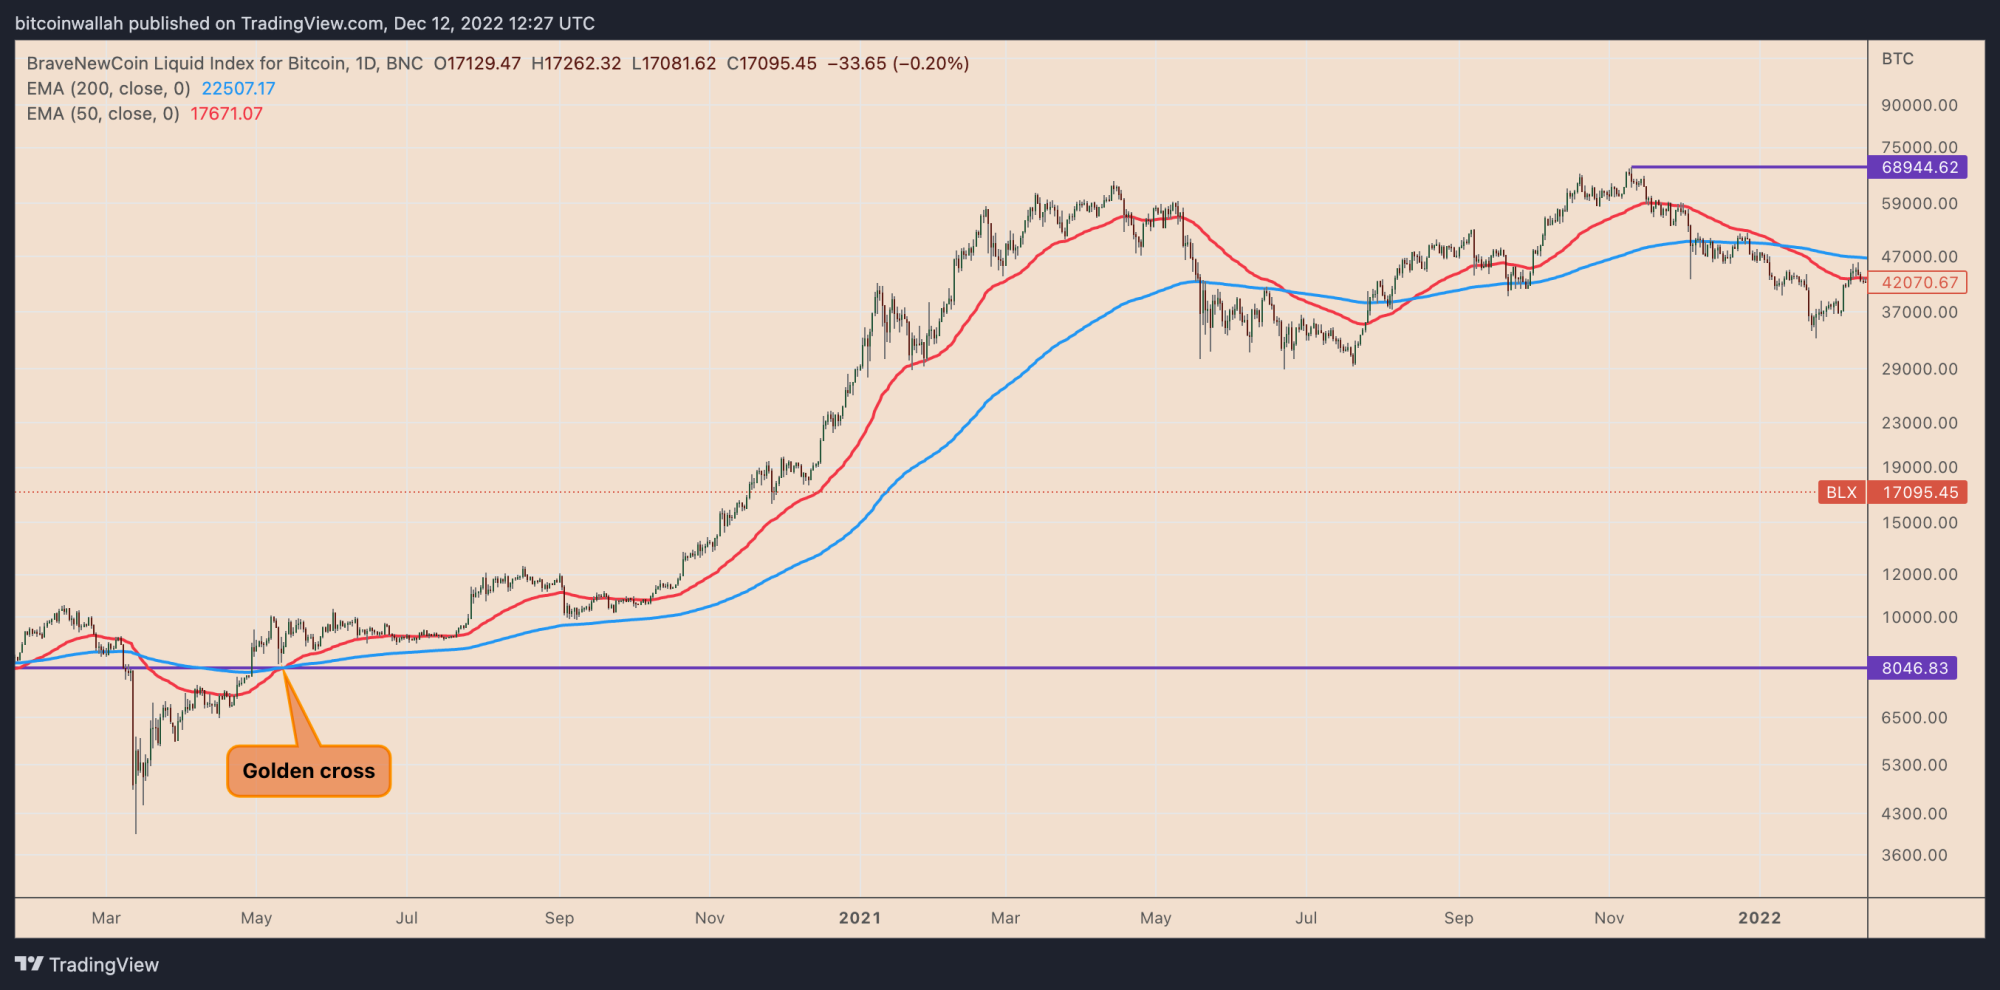
The golden cross has an equally excellent track record when measured against the benchmark cryptocurrency Bitcoin BTC tickers down $26,559. Notably, since 2010, the signal has appeared seven times on the daily Bitcoin charts, five of which have resulted in extremely strong bull runs.
if you are new to crypto-trading this article might be helpful
What is a golden cross pattern
Moving averages (MAs), the golden cross’ fundamental element, will be discussed before the golden cross.
The average price movement for an asset over a given time period is captured by a moving average. They are calculated mathematically by adding a group of prices (recorded over a specific period of time, such as hourly, four-hourly, daily, weekly, or monthly), then dividing the result by the total number of prices in the group.
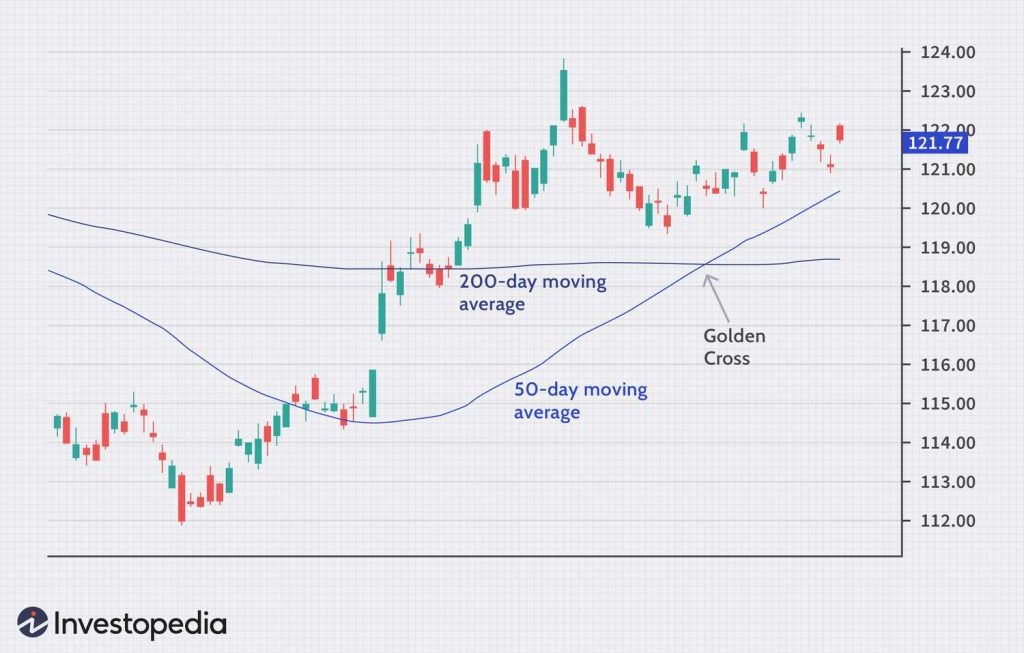
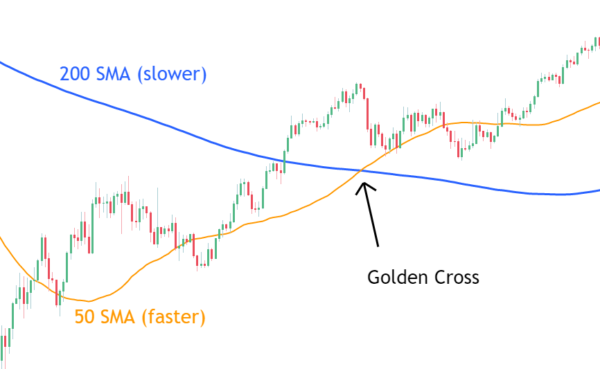
The 50-day moving average, which serves as the short-term MA, and the 200-day MA, which serves as the long-term MA, are the two moving averages that golden cross watchers typically concentrate on.
When the short-term MA crosses above the long-term MA, a golden cross pattern is created. In other words, the pattern indicates that, relative to the preceding 200 days, buying interest in a specific market has increased over the last 50 days.
How does a golden cross work?
Golden crosses are interpreted by traders as buy signals since they frequently precede substantial price rallies in both traditional and cryptocurrency markets.
However, there have been instances where fake breakouts followed golden crosses. Therefore, before making a choice, one should take the golden cross pattern into account in addition to other technical indicators.
To begin with, traders might use the relative strength index (RSI), a momentum oscillator that identifies overbought and oversold levels for an asset, to anticipate probable market pullbacks.
This tactic might have prevented many traders from suffering larger losses in February 2020. Here is why.
Bitcoin’s 50- and 200-day MAs created a golden cross on February 1, 2020, when it traded for about $9,500. After a brief euphoria, the price increased to as high as $10,500 over the course of the next two weeks. Additionally, throughout that time, Bitcoin’s daily RSI increased above the overbought level of 70.
Golden Cross pattern explained in a Video: HERE
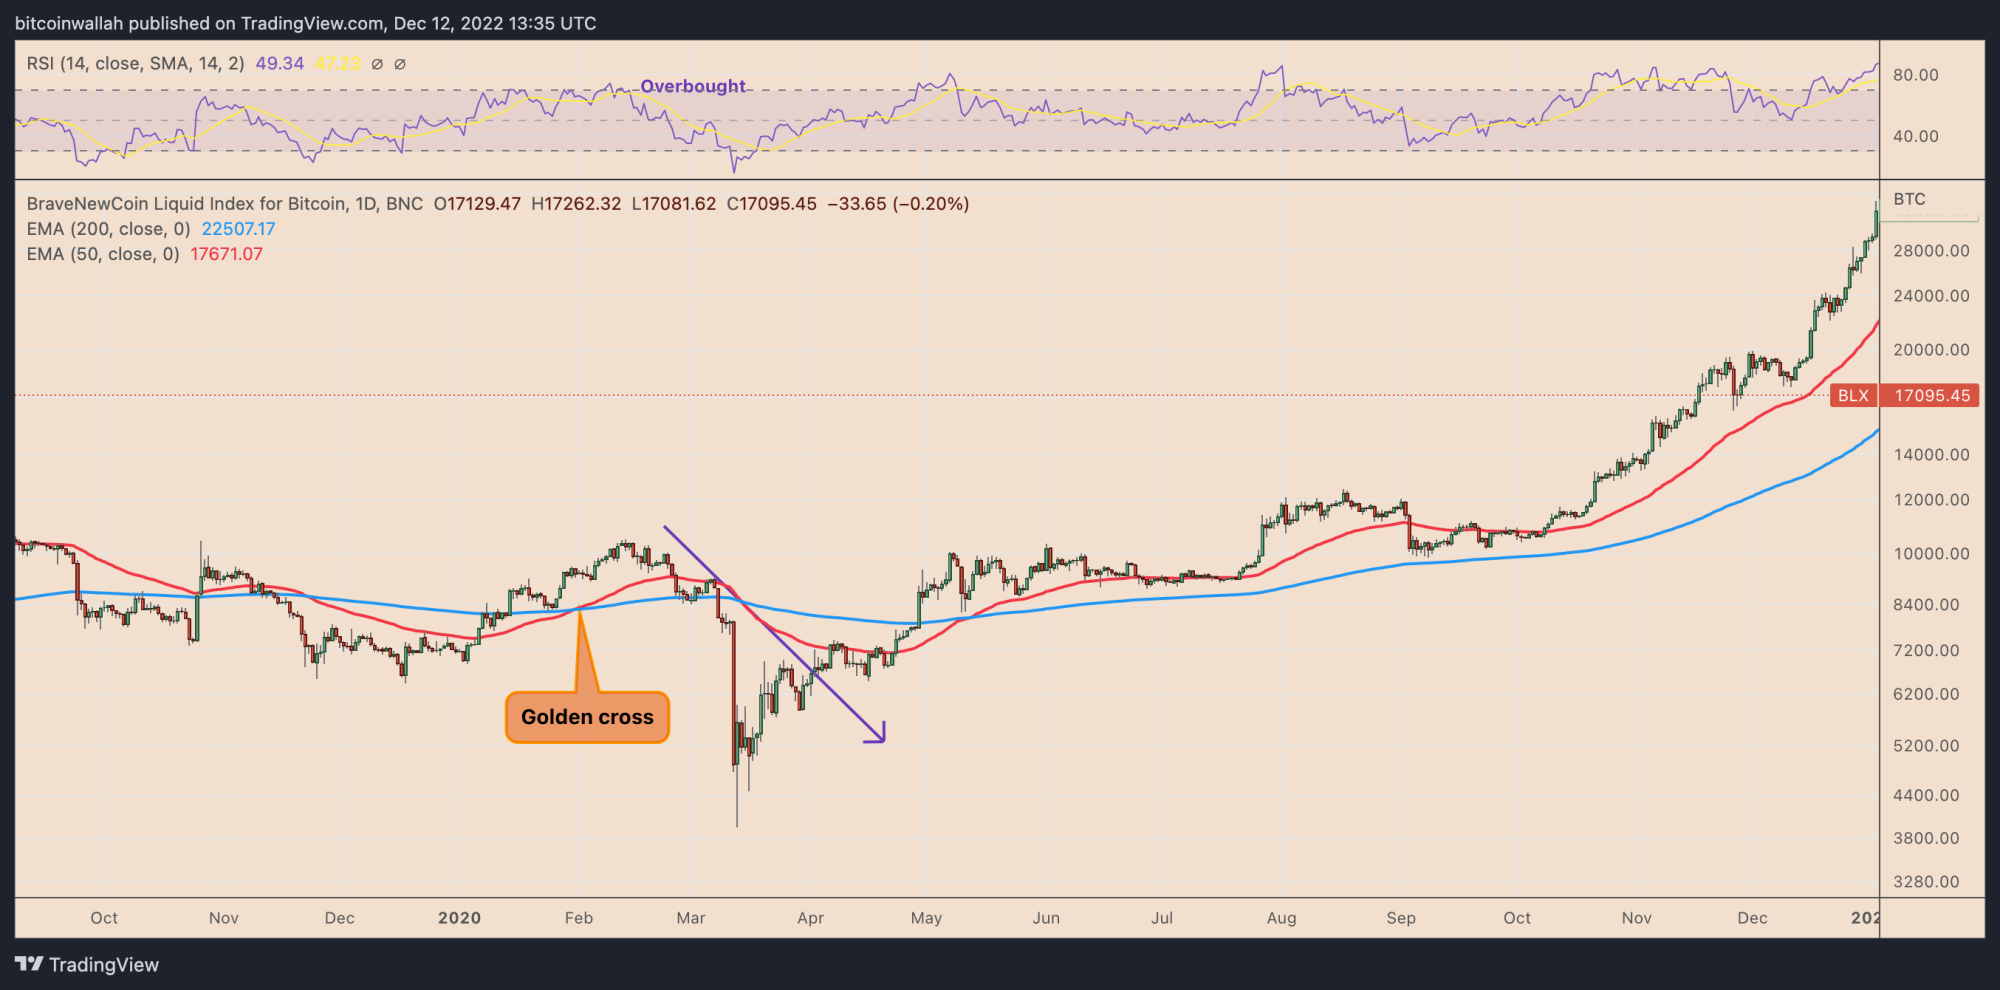
Due to its overbought state, Bitcoin fell towards its 50- and 200-day moving averages (the $8,500–$9,200 range). However, it eventually fell below $4,000 as March rolled around, coinciding with a global market crash brought on by the start of the COVID-19 epidemic.
The case study illustrates that predictions of future trends using golden crosses are not always correct. Instead, they might simply support analysts and traders by using fundamentals and momentum indicators to predict short- and long-term price movements.
Moving Average Convergence Divergence (MACD), Stochastic RSI, Rate of Change (ROC), Average Directional Index (ADI), and other momentum indicators may be among them.
In other words, investors are cautioned against buying into a golden cross formation too soon. Instead, they could decide to wait until the stock settles into a sideways or downward consolidation and encounters short-term support.
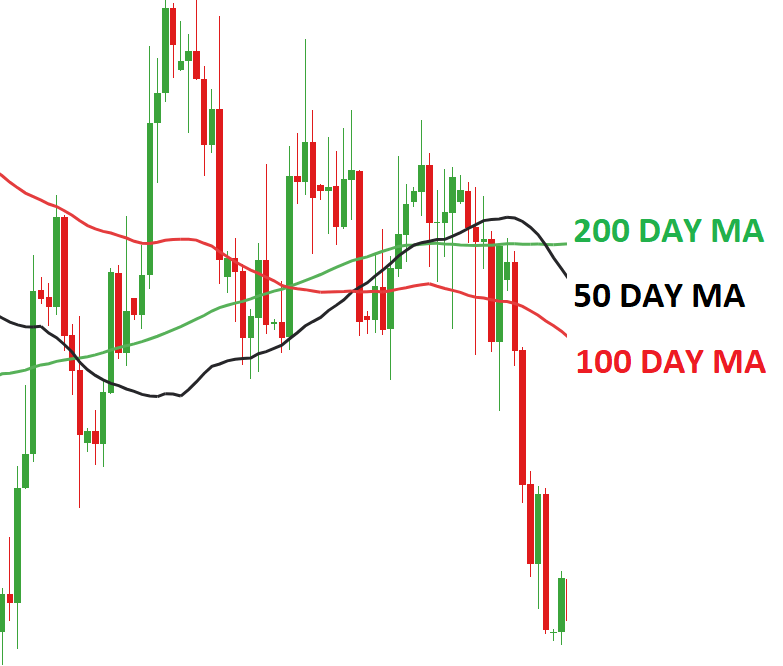
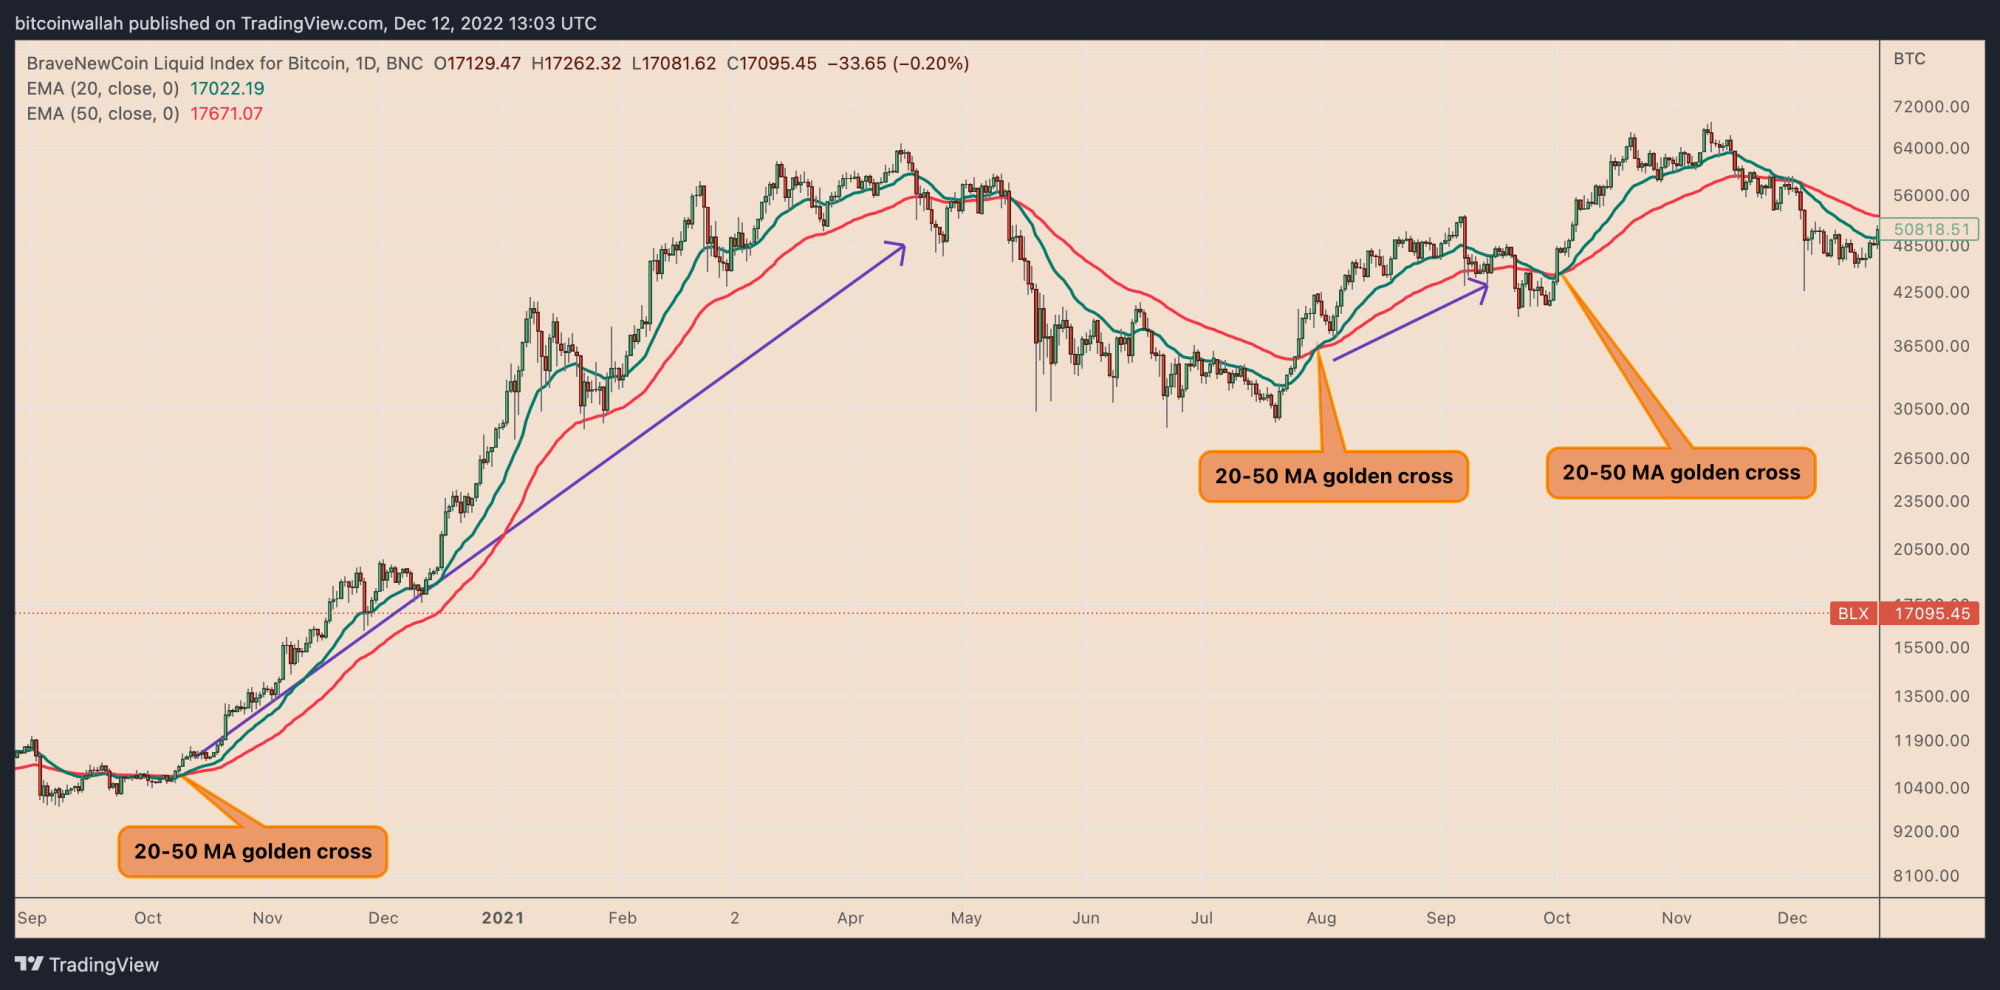
In turbulent market conditions, shifting moving averages can potentially change what constitutes a “golden cross.”
Using the 50-period MA for the long-term MA and the 20-period MA for the short-term MA, for instance. As illustrated below for the bull run from March 2020 to November 2021, the 20-50-day MA combination has traditionally assisted traders in identifying short-term trends in the cryptocurrency market.
Golden crosses don’t mean guaranteed gains
Golden crosses do certainly show before significant price rises in the Bitcoin and cryptocurrency markets, but there is still a chance that bulls can become victims to a trap.
Finally, traders should be cautious when using crossover signals because heedless reliance on them could lead to losses. False signals can appear, as was mentioned previously, thus it’s crucial to verify any golden cross with extra technical indicators before entering any trades.